> ## Documentation Index
> Fetch the complete documentation index at: https://docs.envzero.com/llms.txt
> Use this file to discover all available pages before exploring further.
# Monitoring Dashboards
> Monitor organization activity with summary and activity dashboards showing environment status, deployment counts, top deploying users, and trends.
Dashboards are divided into 2 tabs: Summary and Activity.
# Summary
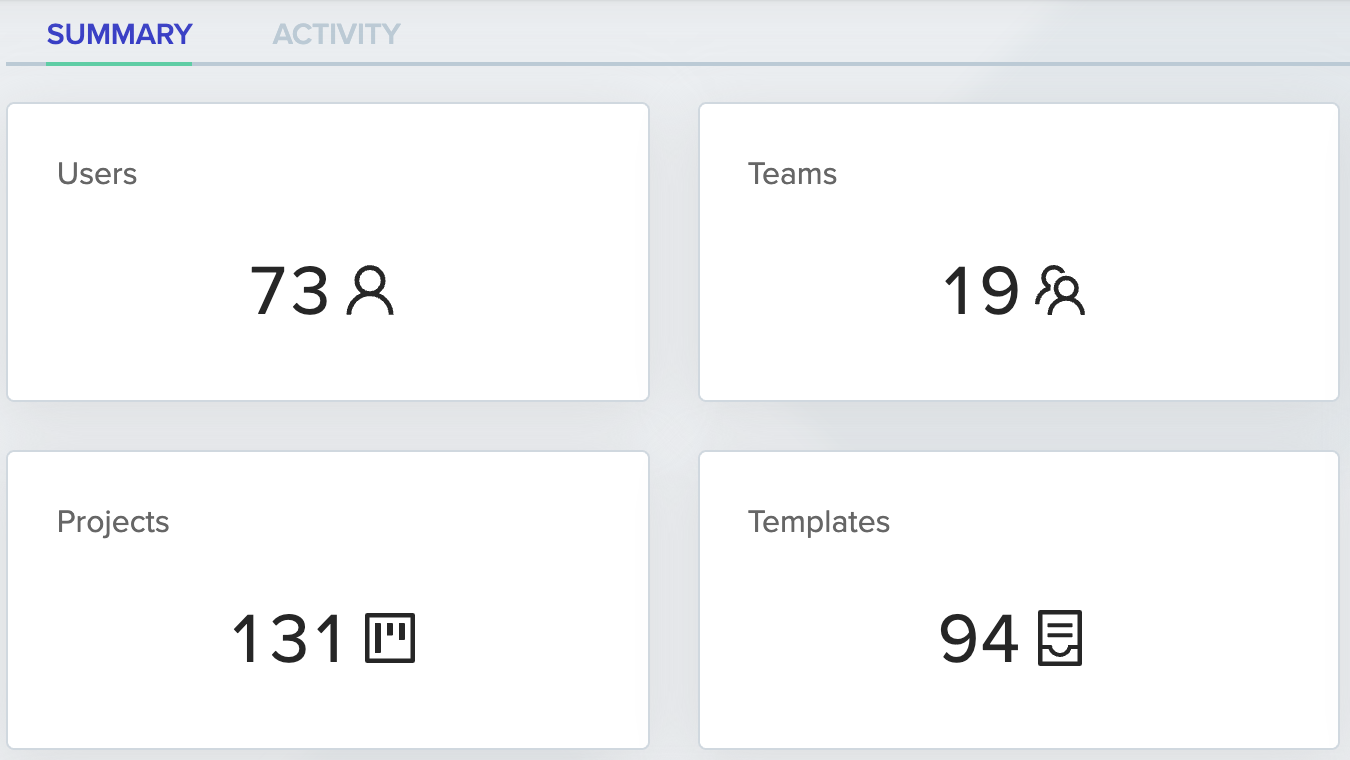
## Counts
Shows total users, teams, projects, and templates.
 ## Environments Pie Chart
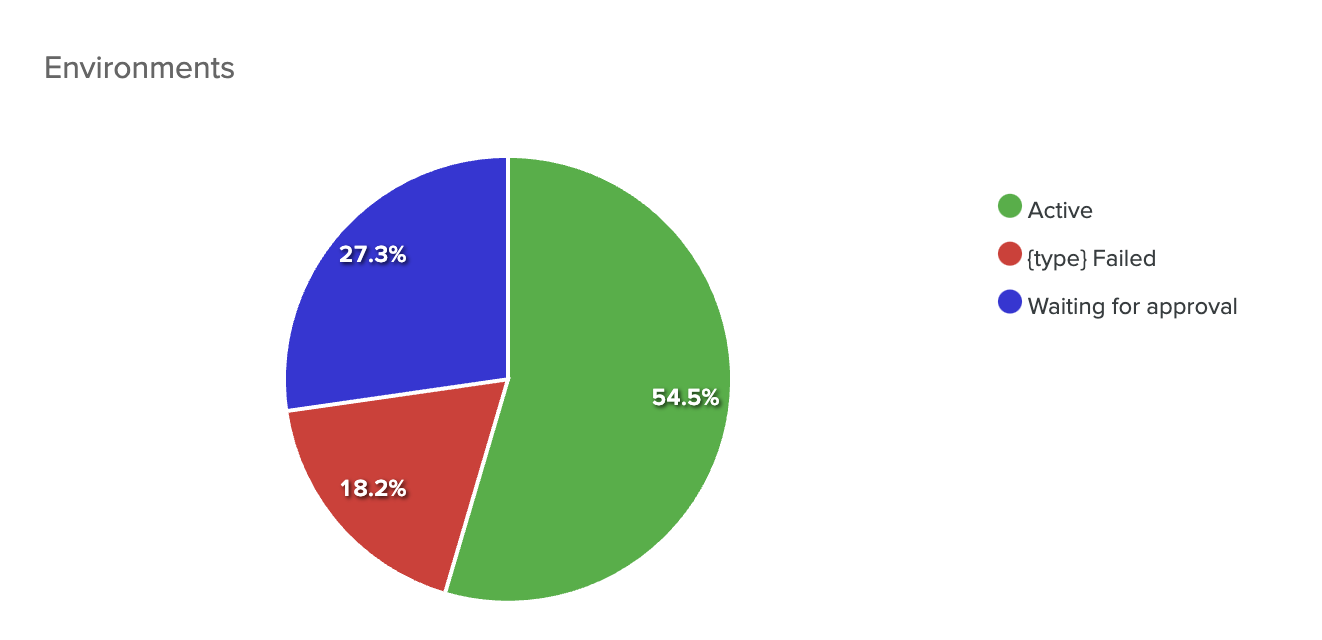
All environments, sliced by status(Active, \[type] Failed, and Waiting for approval)
## Environments Pie Chart
All environments, sliced by status(Active, \[type] Failed, and Waiting for approval)
 ## Environments Table
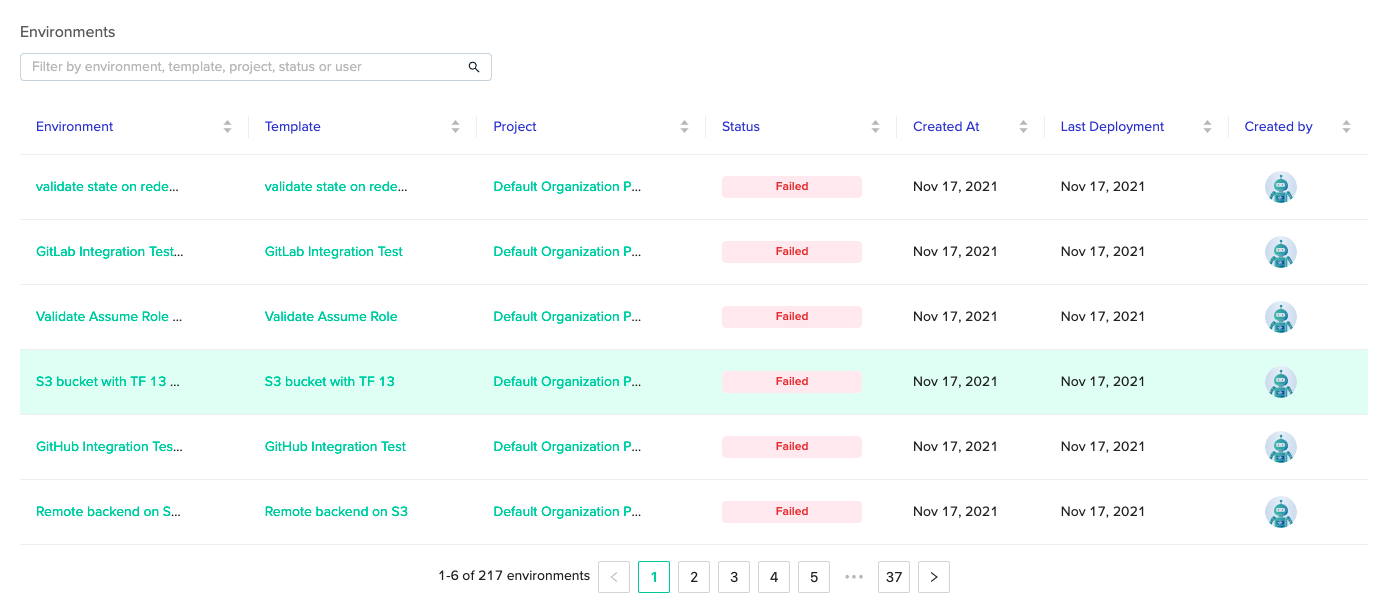
Contains all environments which can be filtered by several attributes such as name, project, status, etc...
## Environments Table
Contains all environments which can be filtered by several attributes such as name, project, status, etc...
 # Activity
Here you can choose a time range using the dropdown menu at the right corner, by last week, month, or quarter.
## Deployments Pie Chart
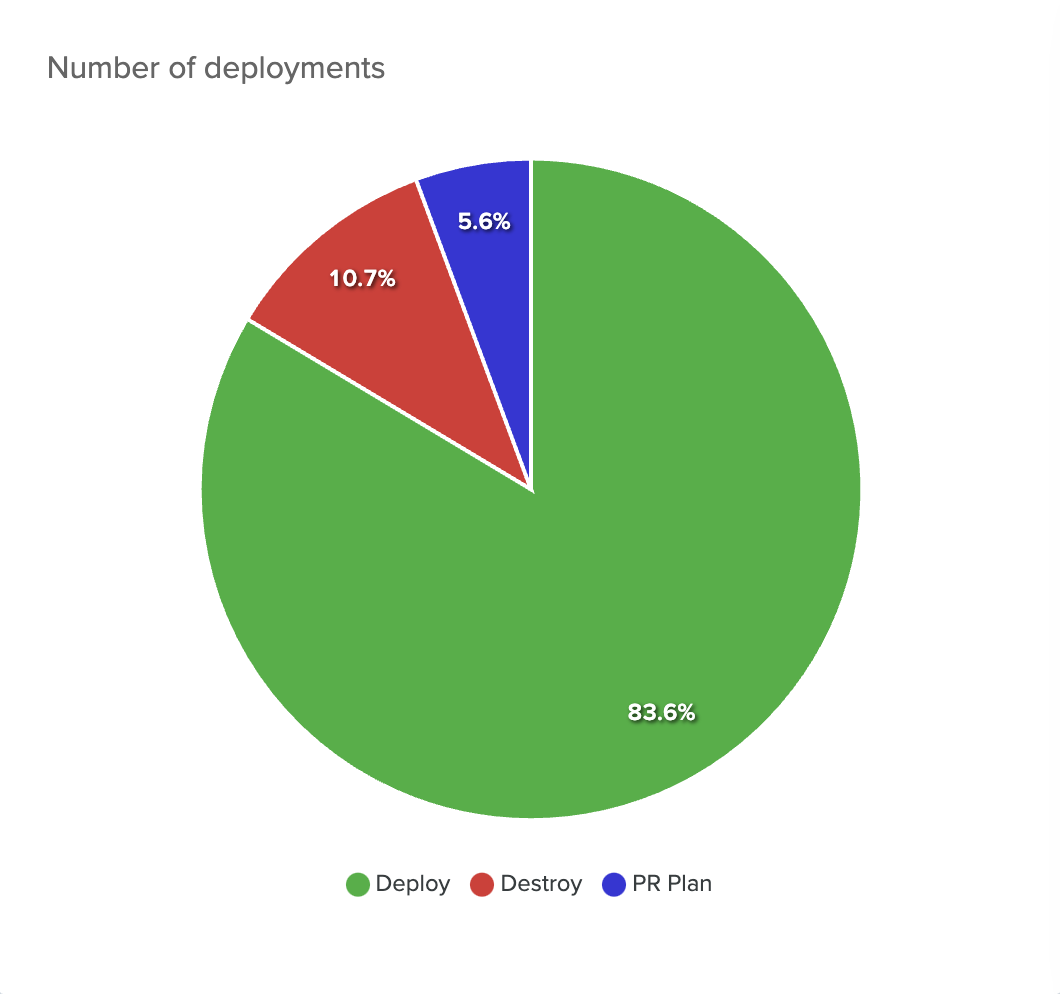
All deployments, sliced by type (Deploy, Destroy, PR Plan). Hovering on it, shows the number.
# Activity
Here you can choose a time range using the dropdown menu at the right corner, by last week, month, or quarter.
## Deployments Pie Chart
All deployments, sliced by type (Deploy, Destroy, PR Plan). Hovering on it, shows the number.
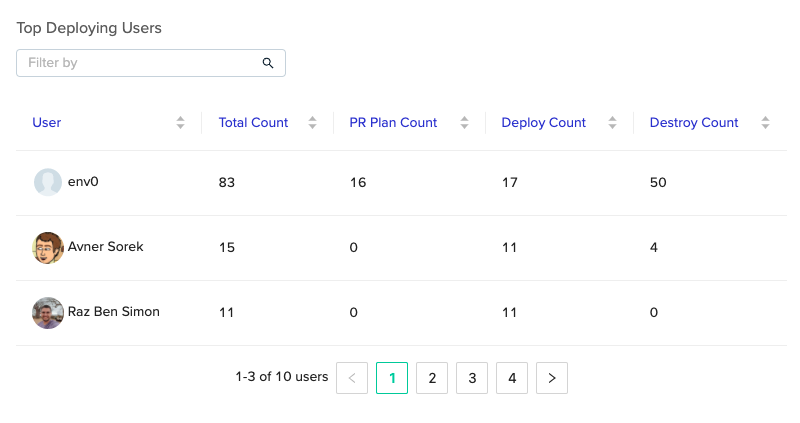
 ## Top Deploying Users
All users, ordered by default by total number of deployments from highest to lowest (can be ordered by other criteria as well).
## Top Deploying Users
All users, ordered by default by total number of deployments from highest to lowest (can be ordered by other criteria as well).
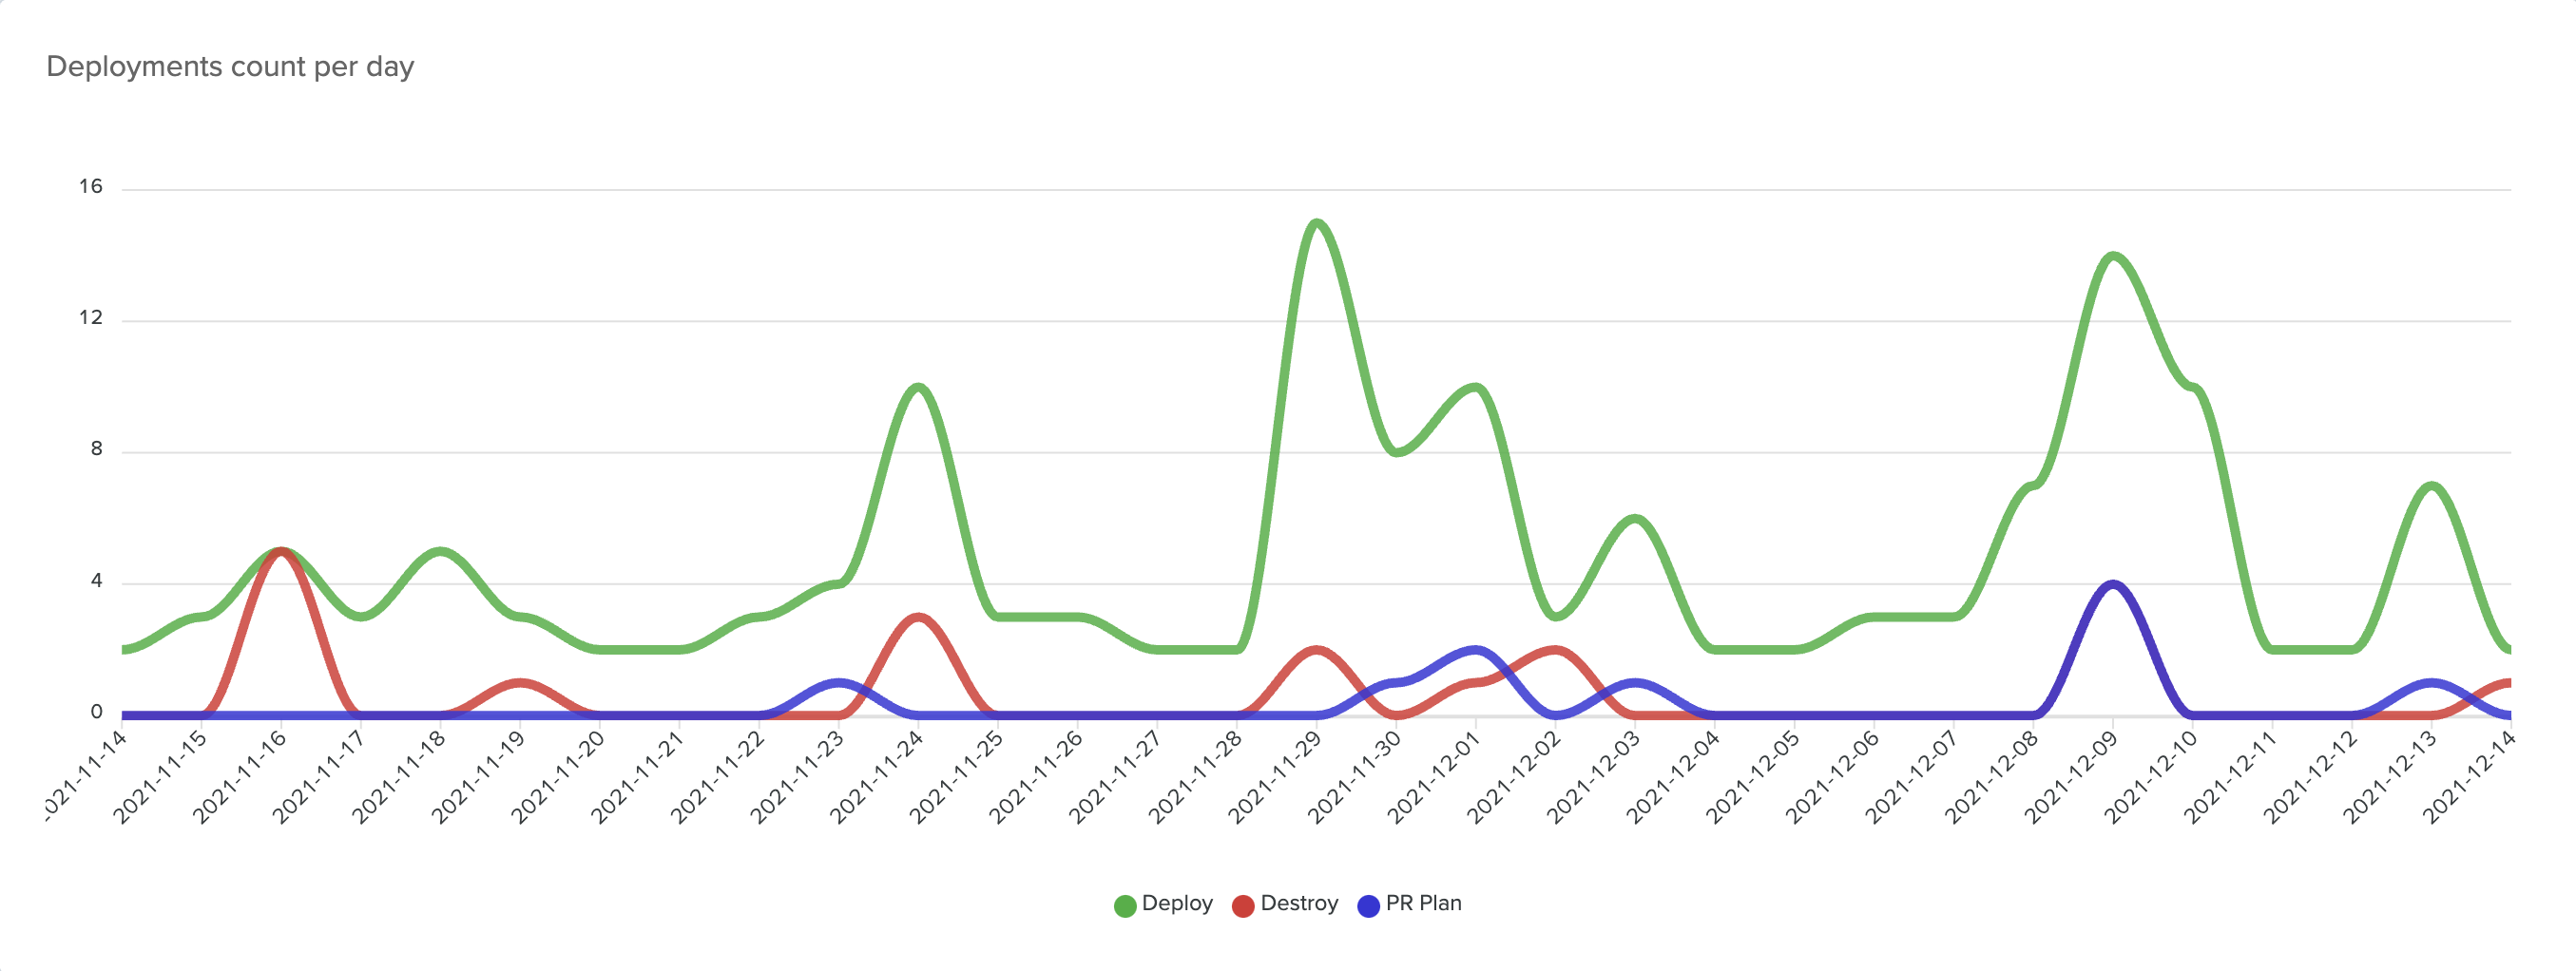
 ## Number of Deployments Per Day
Contains a line chart of each deployment type.
## Number of Deployments Per Day
Contains a line chart of each deployment type.
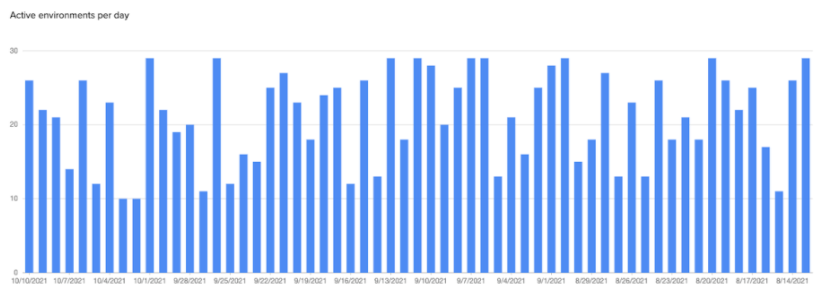
 ## Active Environments Bar Chart
Shows the number of active environments per day. This data is refreshed every 24 hours.
## Active Environments Bar Chart
Shows the number of active environments per day. This data is refreshed every 24 hours.
 ## Environments Table
The same table from the [Summary](/guides/admin-guide/dashboards/#environments-table) tab, but here you can select a time range.
**Calculations**
The data presented in the dashboards is calculated during each page load or refresh. Except for the Active Environments bar chart, which is updated using a schedule task, once a day.
Excluded Data
Archived projects and environments are excluded from the aggregations.
# Weekly email digest
env zero will email organization admins a weekly summary of env zero platform usage, detailing how your teams are using env zero.\
This will include details about your environments, most active users, and deployments per day.
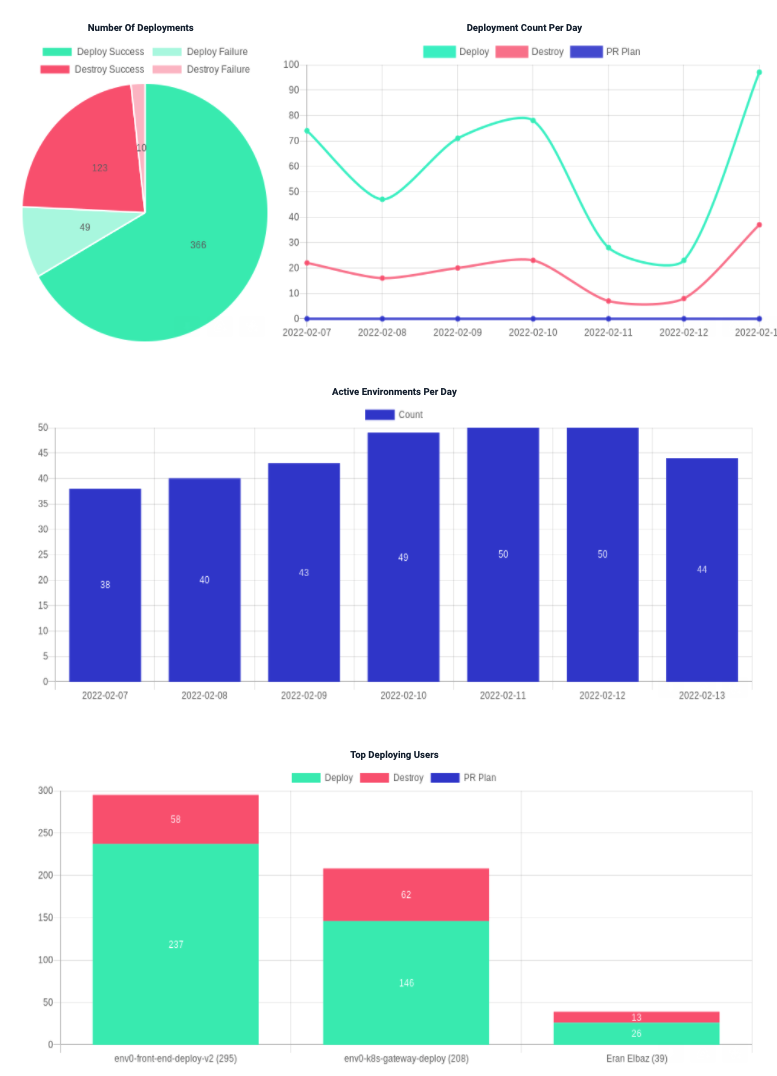
The env zero digest email aggregates data from the past week into four graphs:
1. Number of deployments
2. Deployments per day
3. Active environments per day
4. Top deploying users
## Environments Table
The same table from the [Summary](/guides/admin-guide/dashboards/#environments-table) tab, but here you can select a time range.
**Calculations**
The data presented in the dashboards is calculated during each page load or refresh. Except for the Active Environments bar chart, which is updated using a schedule task, once a day.
Excluded Data
Archived projects and environments are excluded from the aggregations.
# Weekly email digest
env zero will email organization admins a weekly summary of env zero platform usage, detailing how your teams are using env zero.\
This will include details about your environments, most active users, and deployments per day.
The env zero digest email aggregates data from the past week into four graphs:
1. Number of deployments
2. Deployments per day
3. Active environments per day
4. Top deploying users
 ## Next steps
* [View Audit Logs](/guides/admin-guide/audit-logs) - Track individual user actions across the organization.
* [Environment Overview](/guides/admin-guide/environments) - Manage the environments shown in dashboard tables.
* [Set Cost Monitoring](/guides/cost-monitoring/cost-monitoring) - Track cloud spend alongside deployment activity.
## Next steps
* [View Audit Logs](/guides/admin-guide/audit-logs) - Track individual user actions across the organization.
* [Environment Overview](/guides/admin-guide/environments) - Manage the environments shown in dashboard tables.
* [Set Cost Monitoring](/guides/cost-monitoring/cost-monitoring) - Track cloud spend alongside deployment activity.