> ## Documentation Index
> Fetch the complete documentation index at: https://docs.envzero.com/llms.txt
> Use this file to discover all available pages before exploring further.
# Cloud Analyst
> Use env zero Cloud Analyst to query deployment data with AI, build dashboards and insights, and manage environments at scale using the Explorer tab.
env zero Cloud Analyst provides instant access to infrastructure deployment data, enabling teams to ask questions, generate insights, and create dashboards.\
Powered by an AI agent, teams can explore and analyze infrastructure and related DevOps metrics and trends without needing to manually compile data or learn complex models.
**Cloud Analyst is an add-on feature**
Reach out to our support team for more information about enabling Cloud Analyst.
## Getting Started
To begin, go to Cloud Analyst from the left-hand menu in the env zero platform. Once inside Cloud Analyst, you can explore different tabs depending on what you're trying to achieve.
## Key Features:
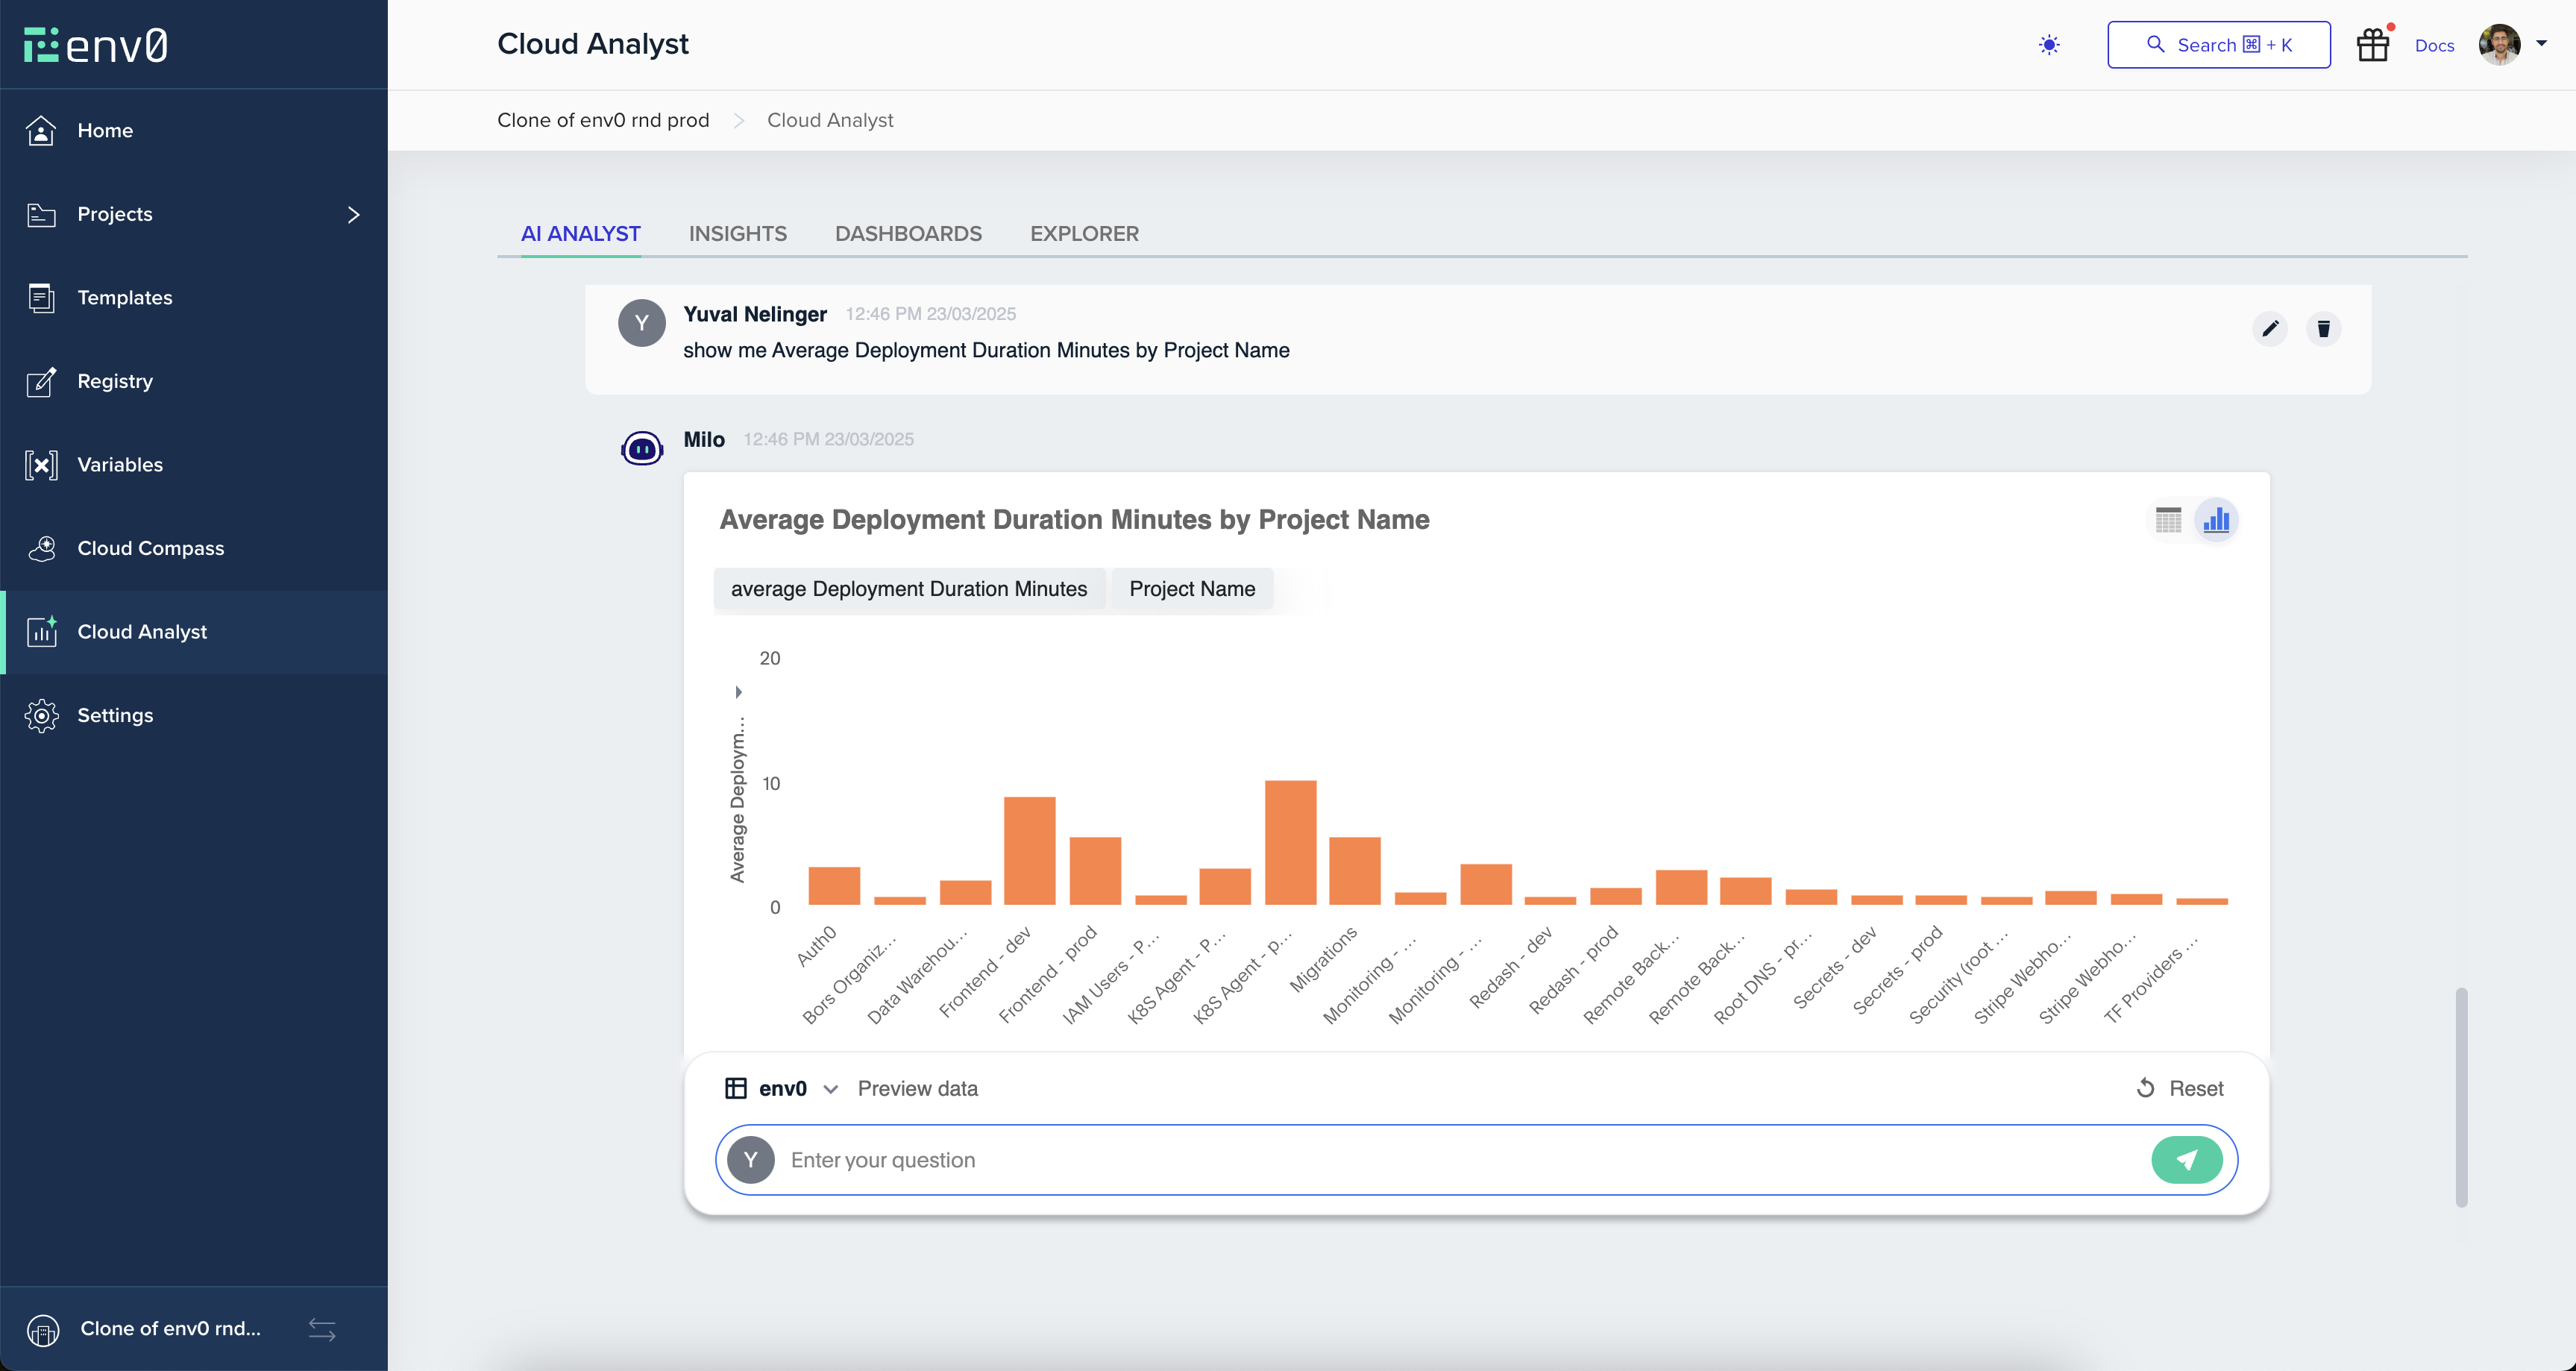
* **AI-Driven Queries** - Ask questions in natural language using the AI Analyst tab. You'll receive a visual response, such as a chart or table, based on the env zero data model. From there, you can:
* **Edit** the result using a visual editor
* **Pin** it to a Dashboard
* **Save** it as an Insight
* **Download** it as PNG, CSV, or XLSX\
[Learn more about AI Analyst](/guides/cloud-analyst/cloud-analyst/ai-chat-interface)
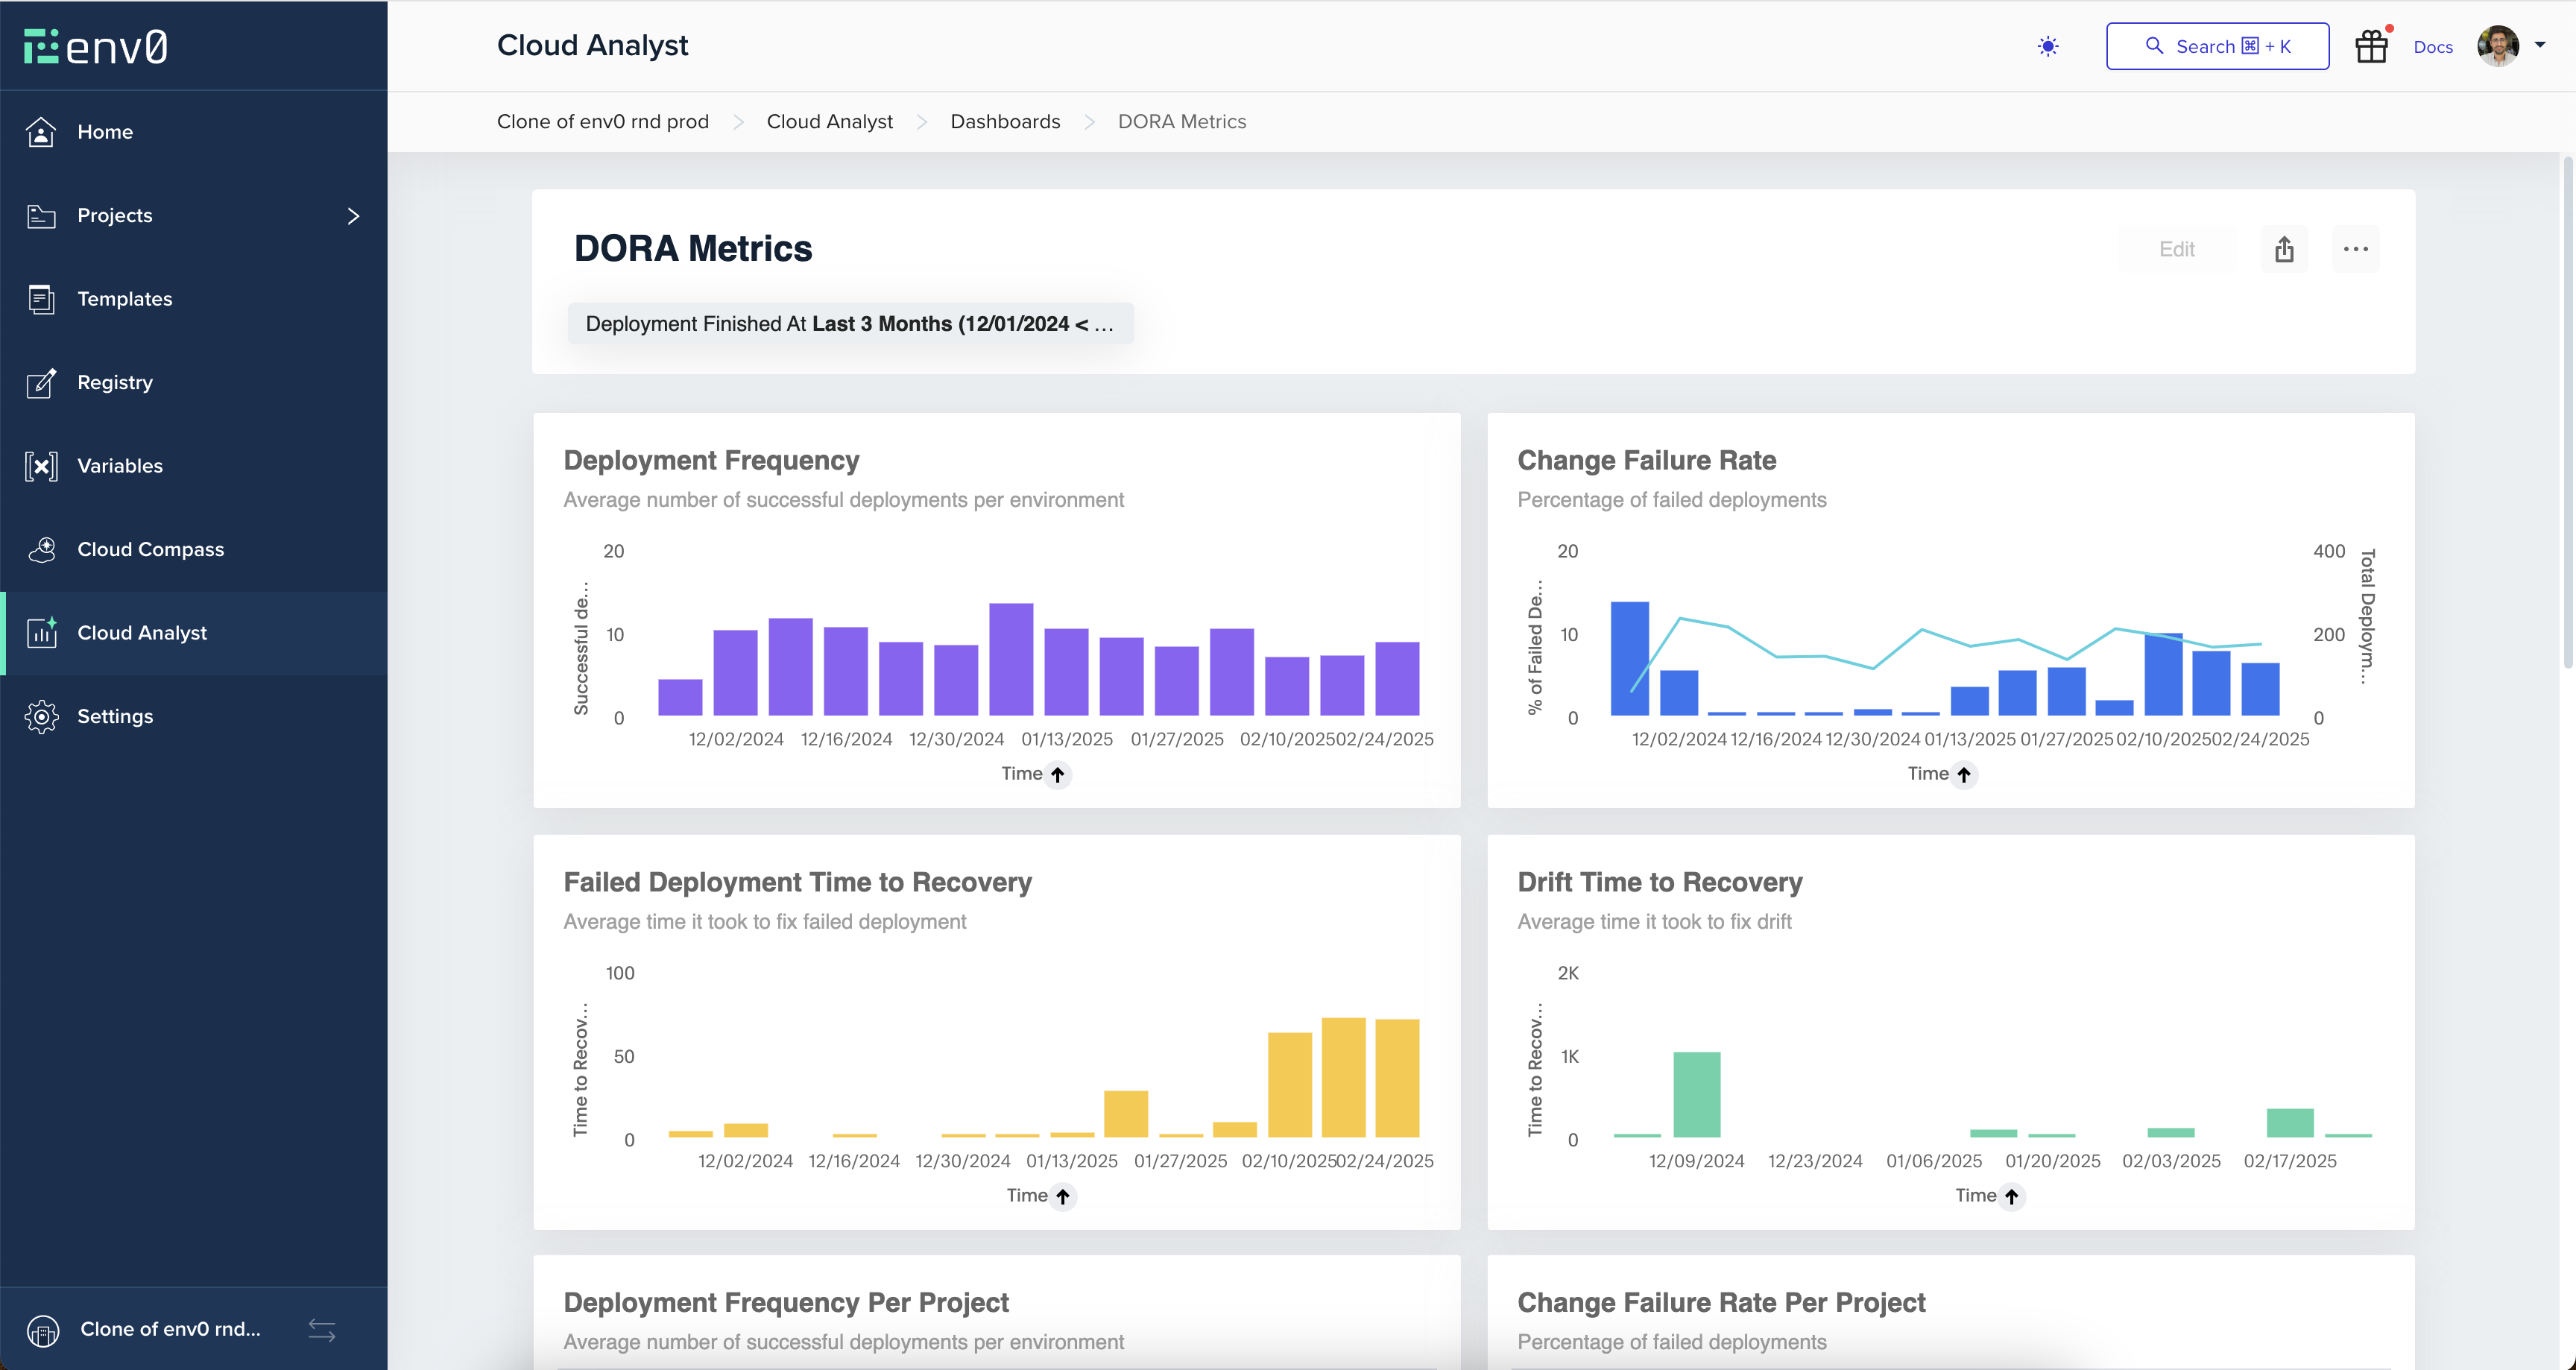
 * **Predefined Charts & Metrics** - Access a library of dashboards answering common questions like DORA metrics, drift trends, and deployment performance.
[Learn more on Dashboards](/guides/cloud-analyst/cloud-analyst/dashboards)
* **Predefined Charts & Metrics** - Access a library of dashboards answering common questions like DORA metrics, drift trends, and deployment performance.
[Learn more on Dashboards](/guides/cloud-analyst/cloud-analyst/dashboards)
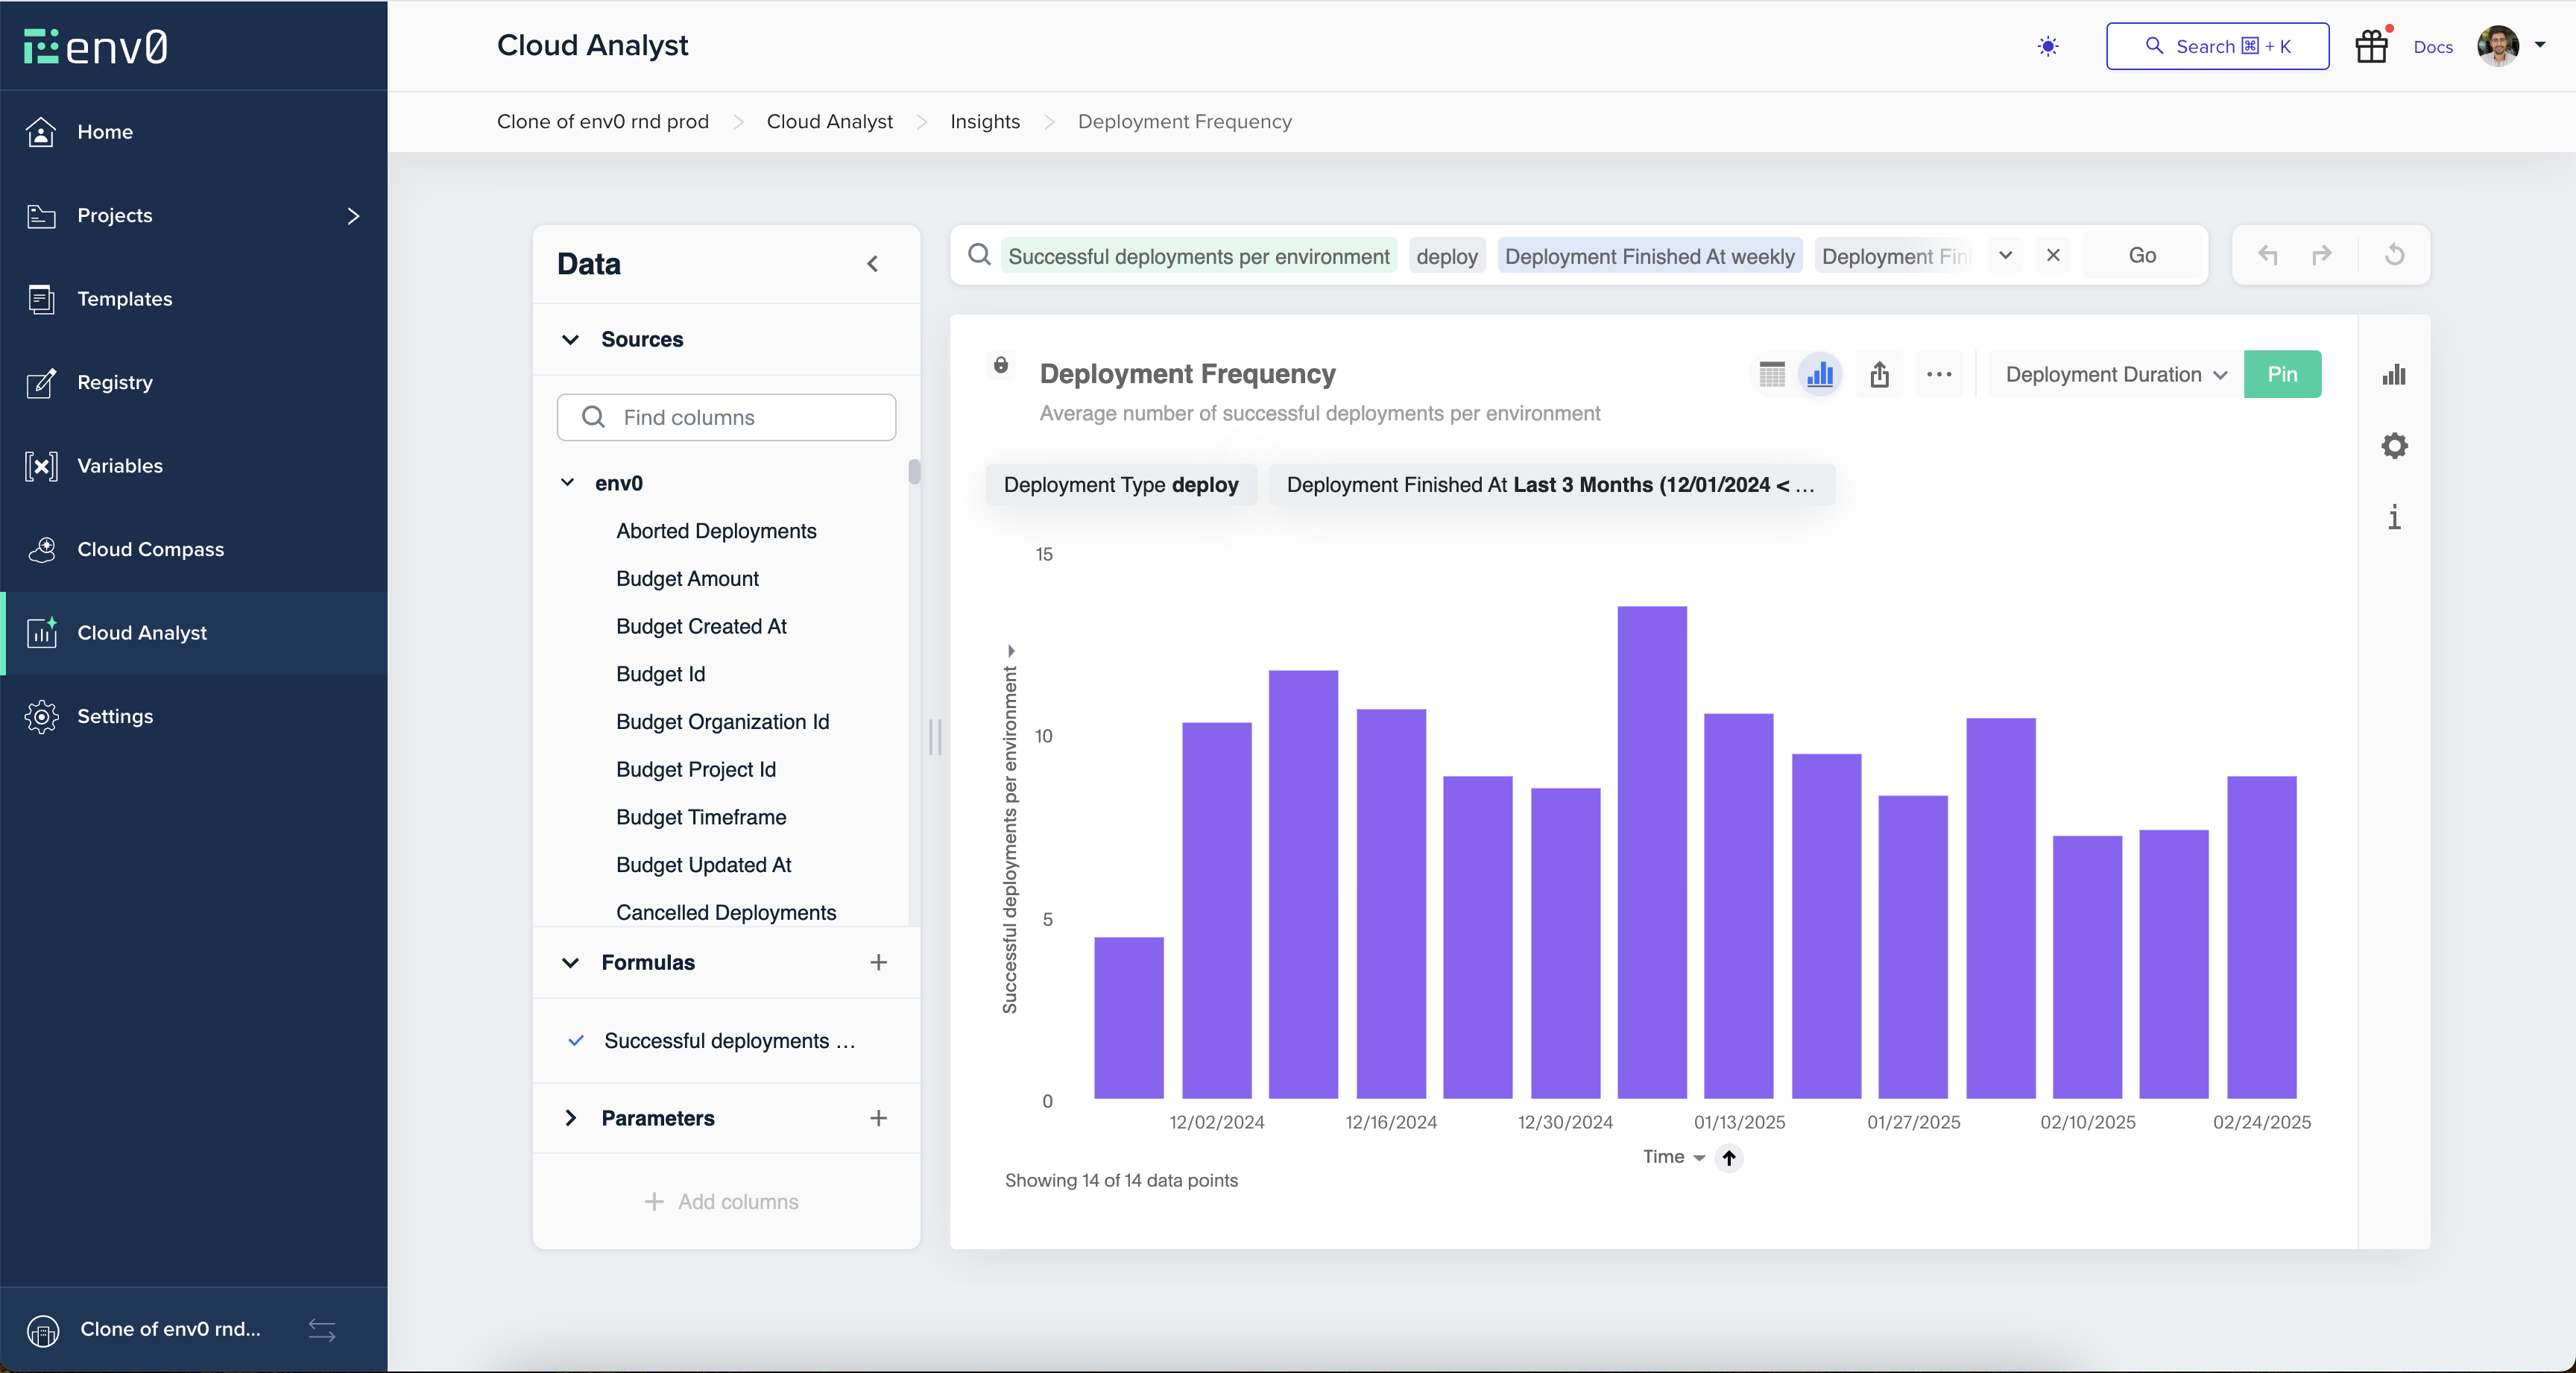
 * **Custom Charts & Metrics** - Use the chart editor to create tailored views. You can choose fields, apply filters, and define aggregations to build exactly the visualization you need. Every chart can be:
* **Saved** as an Insight
* **Pinned** to a Dashboard
* **Edited** later\
[Learn more on Insights](/guides/cloud-analyst/cloud-analyst/insights)
* **Custom Charts & Metrics** - Use the chart editor to create tailored views. You can choose fields, apply filters, and define aggregations to build exactly the visualization you need. Every chart can be:
* **Saved** as an Insight
* **Pinned** to a Dashboard
* **Edited** later\
[Learn more on Insights](/guides/cloud-analyst/cloud-analyst/insights)
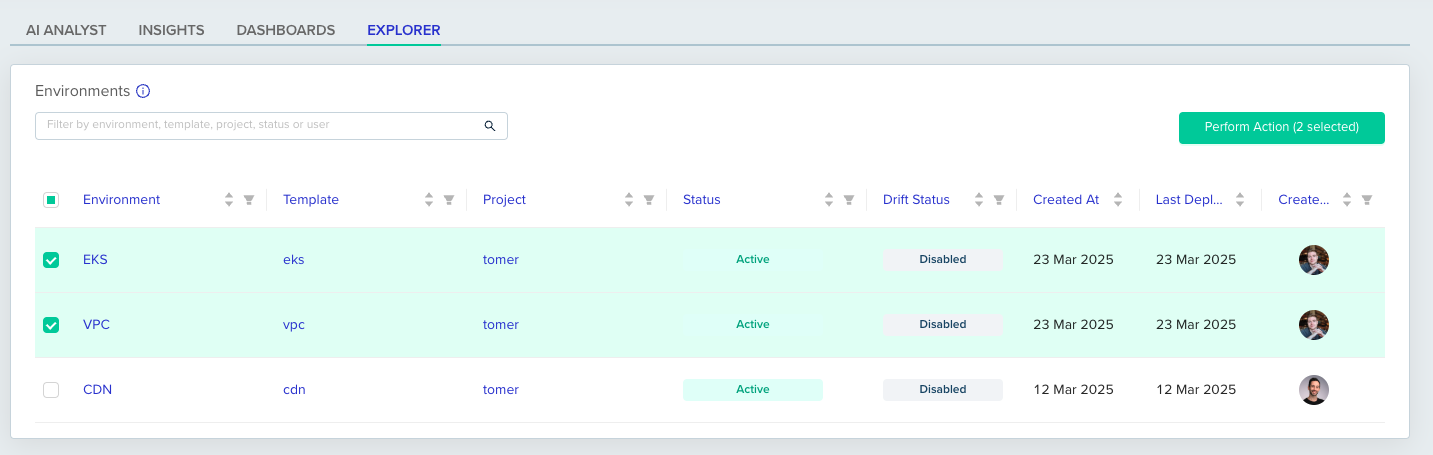
 * **Environment Exploration** - Use the Explorer tab to review and compare all environments. Search, filter, and take bulk actions across multiple environments.
Learn about [Explorer](/guides/cloud-analyst/cloud-analyst/explorer) to start managing environments at scale.
* **Environment Exploration** - Use the Explorer tab to review and compare all environments. Search, filter, and take bulk actions across multiple environments.
Learn about [Explorer](/guides/cloud-analyst/cloud-analyst/explorer) to start managing environments at scale.
 Cloud Analyst is built to give you flexibility. Whether you're asking ad hoc questions, customizing charts, exploring environments, or building dashboards, each part works together to help you gain better visibility and drive decisions from your infrastructure data.\
Everything is powered by the env zero data model, so you're always working with consistent, real-time information. For more details on the structure behind your data, visit the [env zero model](/guides/cloud-analyst/cloud-analyst/env-zero-model) page.
## Next steps
* [AI chat interface](/guides/cloud-analyst/cloud-analyst/ai-chat-interface) - Query infrastructure data using natural language.
* [Dashboards](/guides/cloud-analyst/cloud-analyst/dashboards) - Build dashboards from multiple insights.
* [Explorer](/guides/cloud-analyst/cloud-analyst/explorer) - Search and manage all environments in one view.
* [Cloud Compass](/guides/cloud-compass/cloud-compass) - Discover and categorize unmanaged cloud resources.
Cloud Analyst is built to give you flexibility. Whether you're asking ad hoc questions, customizing charts, exploring environments, or building dashboards, each part works together to help you gain better visibility and drive decisions from your infrastructure data.\
Everything is powered by the env zero data model, so you're always working with consistent, real-time information. For more details on the structure behind your data, visit the [env zero model](/guides/cloud-analyst/cloud-analyst/env-zero-model) page.
## Next steps
* [AI chat interface](/guides/cloud-analyst/cloud-analyst/ai-chat-interface) - Query infrastructure data using natural language.
* [Dashboards](/guides/cloud-analyst/cloud-analyst/dashboards) - Build dashboards from multiple insights.
* [Explorer](/guides/cloud-analyst/cloud-analyst/explorer) - Search and manage all environments in one view.
* [Cloud Compass](/guides/cloud-compass/cloud-compass) - Discover and categorize unmanaged cloud resources.